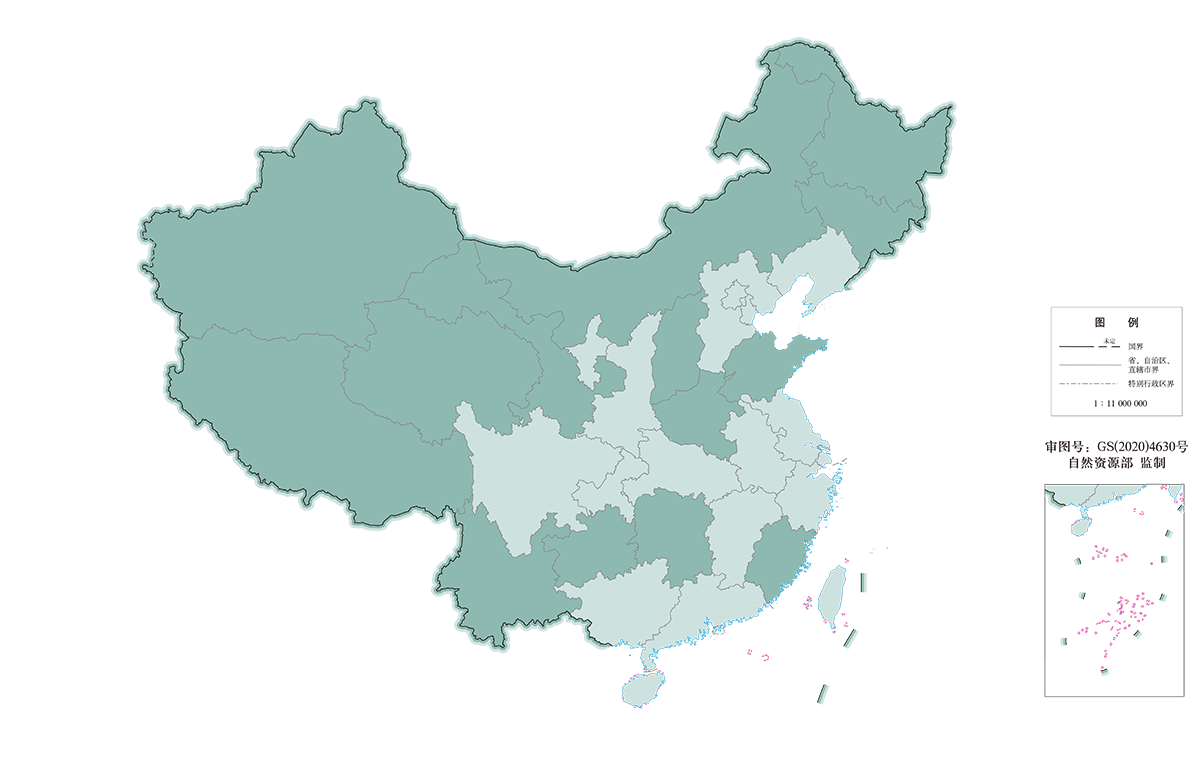
◎ Resources: Silver resources (including associated resources) were 14612 tonnes, which was in the top rank in China. Iron ore resources were 478 million tonnes.
◎ Production: The Group produced 1,088,966kg of silver, representing an increase of 19.45% compared with the same period last year (same period last year: 911,649kg).
Among which,701,508kg of silver was produced from refineries as by-product, representing an increase of 16.37% compared with the same period last year (same period last year: 602,842kg);
387,458kg of mined silver was produced, representing an increase of 25.47% compared with the same period last year (same period last year: 308,806kg).
3.35 million tonnes of iron ore were produced, representing a decrease of 21.09% compared with the same period last year (same period last year: 4.25 million tonnes).
3,643 tonnes of mined-tungsten, 4,576 tonnes of mined-molybdenum and 2,506 tonnes of mined-cobalt were produced.
Certain copper, zinc and gold refineries produced 3,022,987 tonnes of sulphuric acid as by-product, representing an increase of 2.38% compared with the same period last year (same period last year: 2,952,731 tonnes).
◎ Costs: In 2022, the unit cost of sales of mine-produced silver was RMB1.63/gramme, representing an increase of 4.22% compared with the same period last year (same period last year: RMB1.57/gramme); the unit cost of sales of iron ore was RMB214.16/tonne, representing an increase of 2.43% compared with the same period last year (same period last year: RMB209.08/tonne).
◎ Contribution: Sales income from silver, iron ore and other products represented 32.27% (after elimination) of the operating income during the reporting period, the gross profit of which represented 18.33% of the gross profit of the Group.
Ag Main Companies or Mines |
Name |
Ownership |
Consolidated - Mined Sliver (koz) |
Attributable - Mined Sliver (koz) |
Bisha, Eritrea |
55% |
1,603 |
882 |
Duobaoshan Copper in Heilongjiang |
100% |
1,315 |
1,315 |
Luoyang Kunyu |
70% |
1,318 |
922 |
Ashele Copper Mine |
51% |
963 |
491 |
Ziinshan Copper and Gold Mine, Fujian |
100% |
962 |
962 |
Longxing in Russia |
70% |
939 |
658 |
Shanxi Zijin |
100% |
930 |
930 |
Julong Copper, Tibet |
50.1% |
2,131 |
1,068 |
Total of other mines |
2,296 |
1,723 |
Total |
12,457 |
8,951 |
|
|
|
Fe Main Companies or Mines |
Name |
Ownership |
Consolidated-Iron ore (Mt) |
Attributable-Iron ore (Mt) |
Xinjiang Jinbao |
56% |
2.35 |
1.32 |
Makeng Mining |
41.5% |
0.88 (on equity basis) |
0.88 |
Total of other mines |
0.12 |
0.06 |
Total |
3.35 |
2.26 |
|
|
|
|
|
H2SO4 Sulfuric acid |
Name |
Ownership |
Consolidated -Sulphuric acid (kt) |
Attributable - Sulphuric acid (kt) |
Zijin Copper |
100% |
1,059 |
1,059 |
Heilongjiang Zijin Copper |
100% |
699 |
699 |
Jilin Zijin Copper |
100% |
501 |
501 |
Bayannur Zijin |
87% |
376 |
328 |
Xinjiang Ziin Non-ferrous |
100% |
220 |
220 |
Serbia Zijin Copper |
63% |
94 |
59 |
Luoning Zijin |
100% |
73 |
55 |
Total |
3,023 |
2,922 |
 Electronic and Electrical Appliances
 Photo-sensitive Materials
 Chemicals
 Handicrafts and Accessories


